Previously we have examined the extent to which the relationship between attitudes towards Brexit and party support has changed since 2019, when most Leave voters backed the Conservatives and most Remain supporters did not. We noted that support for the Conservatives has collapsed among those who voted Leave in 2016, while support for Labour has increased somewhat more among Leave voters than Remain supporters. As a result, there has been a marked weakening of the relationship between Brexit outlook and party choice. That said, the weakening looks less marked if we look at current attitudes towards Brexit rather than how people said they voted seven years ago. Since 2019 some voters have brought their attitude towards Brexit into line with that of the party they support. At the same time, some of those who have changed the party they support have changed their attitude towards Brexit too.
Still, under Britain’s first-past-the-post electoral system what matters to the parties is not just who is supporting them, but where they reside. Labour, in particular, are confronted with an adverse electoral geography that, unless changed, could require the party to secure as much as a twelve-point lead over the Conservatives just to secure an overall majority of one. Meanwhile, the Conservative seats that Labour are best placed to capture in their quest for a majority are ones that voted more heavily for Leave (the average level of support for exiting the EU was 55.8% in these seats) than the country as a whole. So doing particularly well in Leave-voting areas would open up the prospect for Labour of improving the geography of its support and thus its chances of winning a majority at the next election.
The local elections that took place in much of England outside London on May 5 provide us with a particularly valuable opportunity to assess whether Leave voting places are swinging strongly from Conservative to Labour. There was already reason to believe they were. In particular, the results of last year’s local elections indicated that, in general, the swing from Conservative to Labour since the preceding local elections (that is, May 2021) had been rather stronger in Leave voting areas. However, prior to 2021 the Conservatives had been advancing more strongly in Leave voting areas, in line with what had happened in the 2019 general election, and the movement in the opposite direction between 2021 and 2022 only represented a partial reversal of that pattern.
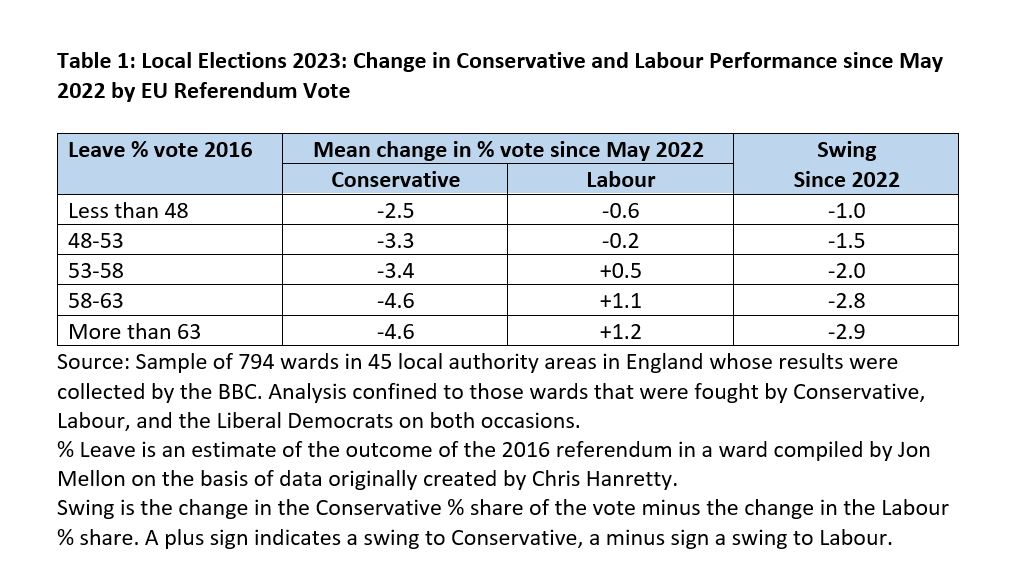
This year’s local elections did witness a further continuation of the pattern evident in last year’s local elections. As Table 1 shows, support for the Conservatives fell somewhat more heavily in those wards that voted most strongly for Leave in 2016 than it did in those that were less supportive of Brexit. Meanwhile Labour’s vote edged up a little in the most pro-Leave wards while slipping back slightly in the least pro-Leave. In combination these patterns ensured that the swing to Labour since last year was some two points higher in the most strongly pro-Leave wards than in the least strongly ones.
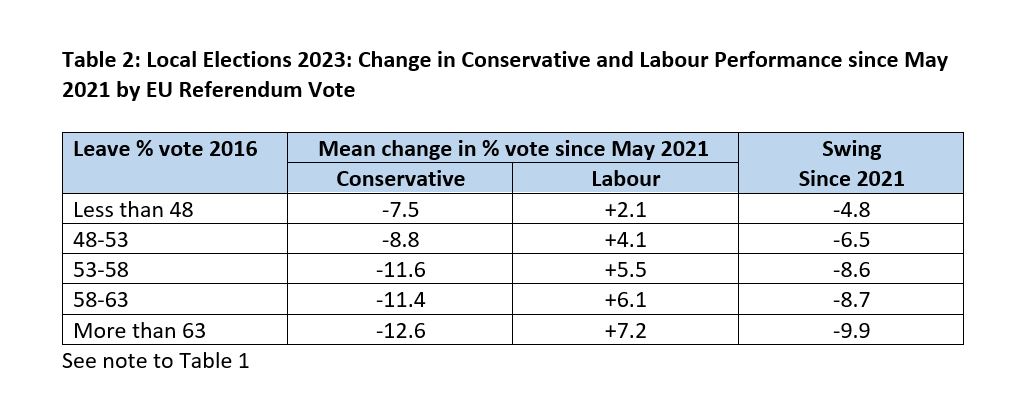
As we might therefore anticipate, and is shown in Table 2, this means there is an even sharper difference between the swing since 2021 in heavily pro-Leave areas and that in places where Brexit was less popular. The fall in Conservative support since May 2021 (when the party was still ahead of Labour in the national opinion polls) is on average five points higher in the most pro-Leave wards than in the least pro-Leave, while the increase in Labour support is five points higher in the most pro-Leave wards. This five-point figure is the product of the two-point difference this year (see Table 1) and a three-point one last year.
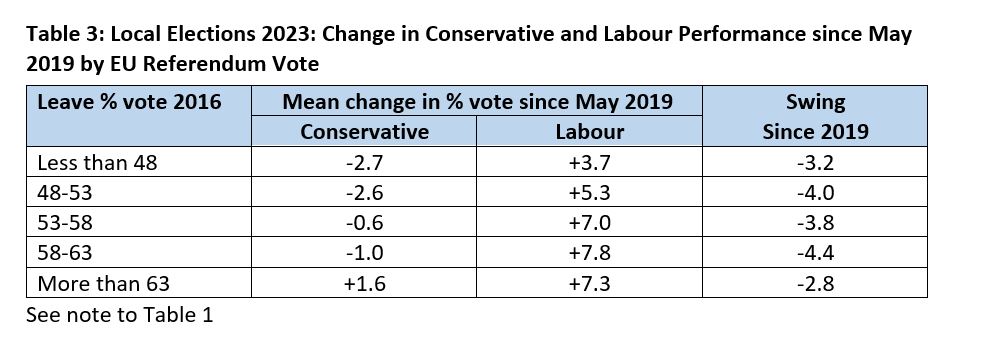
But has this five-point difference been sufficient to reverse the relatively strong advance that the Conservatives had previously recorded in predominantly Leave voting areas? Table 3 tries to address that question by comparing the results of these local elections with those of four years ago, when most of the seats being contested on May 5 were previously up for grabs. It suggests that, in contrast to the position last year, the relative strength of Labour’s performance (and the relative weakness of that of the Conservatives) in the most heavily pro-Leave wards, has now fully reversed the strong swing that the Conservatives enjoyed in such wards up to 2021. In fact, both parties advanced more on that baseline in the most heavily pro-Leave wards (where they both tyoically struggled in May 2019, not least when facing competition from a UKIP candidate), but the net effect is a swing between the two big parties that differs little between the most and least pro-Leave wards.
On this we can cast some light. Changes in ward boundaries have gradually reduced the number of places where ward and constituency boundaries match, a condition that needs to be met if we are accurately to aggregate ward level results into parliamentary constituencies. However, the sample of ward results being analysed here does contain 27 constituencies where the ward boundaries do not cross the constituency boundary and where all the component wards were fought by all three main parties in 2023. These constituencies – like the places in which elections took place this year were as a whole – are disproportionately ones that voted heavily for Leave. In half of them more than 56% voted Leave in 2016. However, the average swing to Labour in these strongly pro-Brexit constituencies was, at -10.5%, somewhat above the -8.0% swing recorded in those where less than 56% backed Leave. On this, admittedly limited evidence, it looks as though Labour have at least fully reversed the particularly adverse swing that the party suffered in heavily pro-Leave seats in 2019.
If so then, other things being equal (and bearing in mind that the revision of parliamentary boundaries currently under way is likely to be somewhat disadvantageous to Labour), the electoral system is likely to treat Labour less harshly than it did in 2019, thereby making it easier for the party to secure an overall majority. But that does not necessarily mean that all of the impact of Brexit on the geography of party support since the EU referendum has disappeared. In the 2017 general election the Conservatives advanced strongly on their tally in 2015 in Leave voting constituencies, thanks not least to the collapse in support for UKIP. In contrast, the party fell backwards in the most pro-Remain parts of the country. If the geography of party support has now reverted to what it was in 2017, the Conservatives could still be much stronger in Leave-voting Britain than they were before the EU referendum.
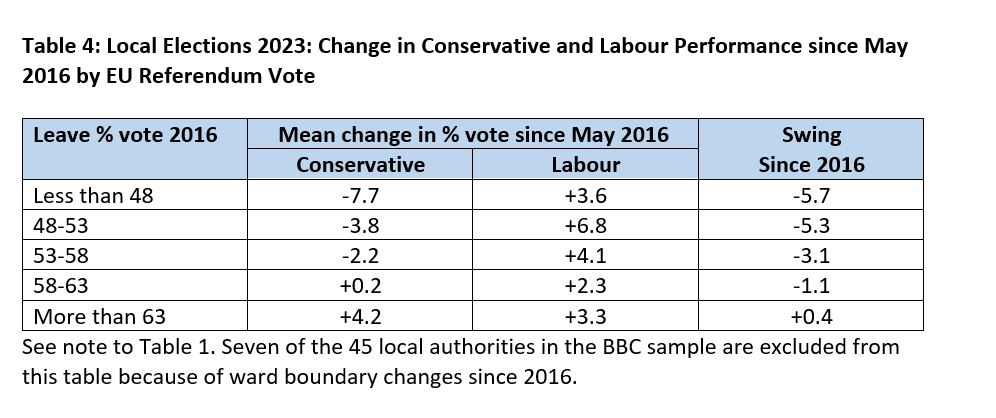
Table 4 suggests this is indeed the case. Conservative support was on average four points higher this year than in May 2016 (before the EU referendum) in the most heavily pro-Leave wards (where it was most likely to face competition from UKIP in 2016), whereas the party’s support was down nearly eight points in the least pro-Leave. Thus, although there is no consistent relationship between how strongly a ward voted Leave in 2016 and the increase in Labour support, the net swing from Conservative to Labour since 2016 is still markedly higher in the most least pro-Leave wards.
It appears that so far as the electoral geography of Conservative and Labour support is concerned, we are now roughly back to the position in the 2017 election, but not to where we were before the EU referendum. And while the electoral geography of the 2017 election was not as disadvantageous to Labour as that which emerged in 2019, it still put Labour at something of a disadvantage. It implied that Labour needed a seven-point lead over the Conservatives in order to secure an overall majority, whereas the Conservatives only needed a three-point lead. Securing a seven-point lead is much easier for Labour than meeting the twelve-point target with which the geography of the 2019 election presented it. But it will not necessarily be that easy.
Acknowledgement
Much of the analysis reported here was undertaken with the help of Patrick English, Stephen Fisher, Rob Ford, and Dan Snow. Responsibility for the views expressed lies with the author.
By John Curtice
John Curtice is Senior Research Fellow at NatCen and at 'UK in a Changing Europe', Professor of Politics at Strathclyde University, and Chief Commentator on the What UK Thinks: EU website.
The analysis does point to a complicated situation but where I live, which voted Remain, Labour though second to the Tory in 2019 has seen votes switching to the LibDems (who won seats in local council elections). If tactical voting comes into the picture at the next election the LibDems will win the majority of the Remain votes and if they displace Labour, as they did in the local elections, Labour voters (including presumably Leave voters) may well switch to the LibDem candidate to displace the sitting Tory MP. If that happens no Tory held seat with a majority under 20,000 can be called safe.Report
Seems to me Adrian Phillips conclusion is more likely than not correct especially as the government’s deep ties to Brexit are likely to weigh against them vv food inflationReport
Thank you John for the analysis,
It would be interesting to know how far the anti-Conservative vote in 2023 was due to disenchantment with the reality of Brexit, as opposed to disenchantment with the government. While these two are hard to disentangle, I would guess that many people who were persuaded to vote for Brexit in 2016, and for the Brexit-supporting Conservatives in 2019, have become so disappointed with the outcome that it might turn them against the party that sold it to them at the last GE.Report