In recent blogs we have chartered how public opinion has swung away from backing Brexit, thanks not least to greater pessimism among Leave voters about the economic consequences of being outside the EU. Meanwhile, most Remain voters, though only a minority of Leave supporters, would like a closer relationship with the EU than that provided by the Trade and Co-operation Agreement.
But what has happened to the political divide over Brexit? Is it no longer an issue that influences people’s party preference? After all, both Labour and the Liberal Democrats (though not the nationalist parties) have dropped their opposition to the principle of leaving the EU and this has helped ensure the issue has received relatively little attention at Westminster for much of this parliament. Indeed, Labour now promises to, ‘Make Brexit Work’, suggesting that a Labour government would implement Brexit more effectively (if perhaps in a softer form) than the current Conservative administration. Against this backdrop we might anticipate that the relationship between people’s views about Brexit and the party they support has weakened significantly since the 2019 election, when both Labour and the Liberal Democrats were willing to contemplate holding a second referendum on leaving the EU, a ballot that might have resulted in a reversal of the decision to leave the EU.
On the other hand, we cannot presume that voters have picked up these changed cues from the opposition parties – and the Conservatives, at least, are not inclined to encourage them to do so. Indeed, the polling undertaken by Redfield & Wilton for UK in a Changing Europe suggests that many have not. In the most recent poll, undertaken in December, 41% of voters said that Labour’s objective was to re-join the EU, while only 28% said that the party wanted to stay out – although this latter figure was up from the 18% who held that view last spring. Meanwhile 40% still believe that the Liberal Democrats wish to re-join the EU, while only 18% believe that the party wishes to stay out. Meanwhile, as we might anticipate, voters are clearest above all about where the Conservatives stand – 59% believe the party wishes to stay out, while just 18% feels it wants to re-join.
To begin our analysis, Table 1 shows the distribution of party preference on three occasions, at the time of the last election, in May 2022, and in January 2023, broken down by how people voted in the 2016 EU referendum. The data for May 2022 and January 2023 are based on an average of the figures from those polling companies that published a poll in those months and provided a breakdown of their figures by how people voted in 2016.
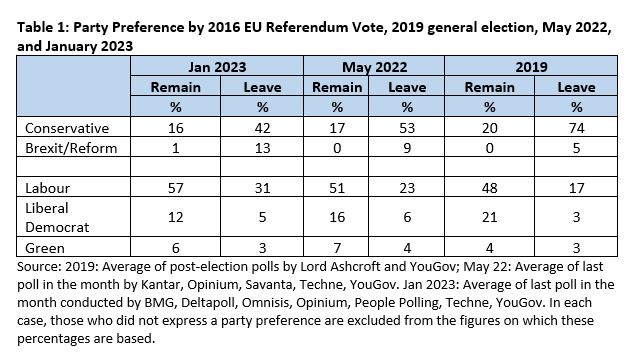
Three points are immediately apparent. First, the Conservatives have lost ground more heavily among those who voted Leave in 2016 (down 32 points between 2019 and January 2023) than they have among those who voted Remain (down just four points). In part this reflects the fact that the party’s support was so much lower in 2019 (and thus could not fall so far) among Remain supporters (20%) than among Leave voters (74%). However, it does mean that the crucial foundation of the Conservatives’ success in 2019, the party’s ability to unite most Leave voters under its wing, is no longer in place. Second, the Liberal Democrats have endured a marked decline in support among Remain voters (a drop of nine points) but may have secured a modest increase in popularity among Leave supporters (an increase of two points). Diminished as their overall support currently is, the Liberal Democrats have, perhaps, become once more a party of general protest and less one whose appeal rests heavily on opposition to Brexit. Third, Labour’s advance since 2019 has been somewhat stronger among 2016 Leave voters (a rise of 14 points) than it has been among Remain supporters (an increase of nine points). Labour would appear to have had some relative success in reconnecting with the kind of voter that cost it dearly in the ‘Red Wall’ in 2019. That said, the difference between the party’s progress among 2016 Leave voters and that among their Remain counterparts is the least of the three parties, suggesting that much of its progress may have had little to do with Brexit.
These patterns are not new. Even by May of last year, when the Conservatives were on average only seven points behind Labour in the polls rather than 22 points behind as now, support for the party had fallen much more heavily among 2016 Leave voters (by 21 points) than it had among their Remain counterparts (a fall of three points). The Conservatives have simply haemorrhaged yet more support among Leave voters since then. Equally, much of the somewhat higher increase in Labour support among 2016 Leave voters was already in evidence by May of last year, while Liberal Democrat support was already looking more fragile among the party’s former Remain voting supporters. The last half year or so has simply witnessed a continuation of trends that were already in place.
So, as compared with the position at the last election, there has seemingly been a marked diminution in the strength of the relationship between party preference and people’s views about Brexit. However, as our recent blogs have emphasised, some voters have changed their minds about Brexit since 2016. This raises two possibilities. First, perhaps voters who in 2019 backed a party whose views at that time on Brexit were not commensurate with how they voted in 2016 have been particularly likely to have changed their minds about Brexit. For example, perhaps Labour supporters who voted Leave in 2016 have been particularly likely to have decided that Brexit was a mistake? Second, perhaps voters who have changed their minds about Brexit have also been inclined to switch the party they support. For example, maybe 2016 Leave voters who supported the Conservatives in 2019 but who would now vote to re-join the EU have also defected from the Conservatives. Meanwhile we should also bear in mind that the party preferences of those who did not vote in 2016 might tend to reflect their views on Brexit in the party they now support. Maybe, for example, those who have come of age since 2016 and who wish to stay in the EU are disinclined to support the Conservatives at the ballot box.
If present, all three of these processes could serve to sustain the relationship between current attitude towards Brexit and current party preference – and ensure that the link is stronger than Table 1 implies. In any event, to make an initial assessment of what difference current Brexit preference makes, we use data from the British Election Study Internet Panel, a large academic survey that on each occasion interviews 30,000 people and which has been undertaken periodically since 2014. In Table 2 we use these data to compare the relationship between current Brexit preference and party support at the time of the 2019 general election with the equivalent relationship in the most recently available wave of the BES study, which was conducted in May of last year.
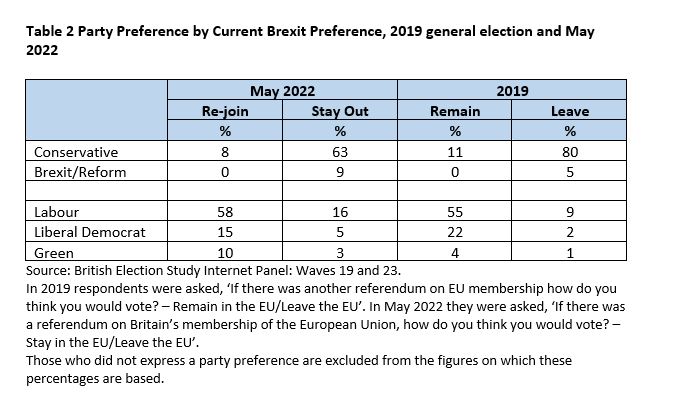
This table shows a somewhat different picture. In the case of the Conservatives, there is a 55-point gap in Table 2 between the level of support for the party among Leave voters and that among Remain supporters. The equivalent figure in Table 1 is 36 points. (Note that the BES’s own estimates of the level of party support by 2016 vote in May 2022 is almost identical to those in Table 1.) Meanwhile, support for Labour among current Remain supporters is 42 points higher than that among current Leave supporters whereas the difference in May 2022 in Table 1 is 28 points. The relationship between current Brexit vote and party support is rather stronger than that between how people voted in 2016 and their current party preference.
That said, this was also the case in 2019 (a point we have made previously and can be seen by comparing the 2019 entries in Tables 1 and 2). As a result, it is still the case that the relationship has become less strong than in 2019. Not surprisingly given how few current Remain supporters voted Conservative in 2019 (just 11%), at three points the drop in Conservative support among this group in the latest BES is much less than the 17 point fall among Leave supporters. At three points, the increase in Labour support among Remain supporters is somewhat less than the seven-point rise among Leave supporters though, as in Table 1 the difference between the two groups looks decidedly modest. Indeed, just 16% of the party’s supporters in May were current supporters of Brexit, up only four points on 2019. Meanwhile, as in Table 1, support for the Liberal Democrats is well down among current Remain supporters (by seven points), while it is up a little (three points) among their Leave counterparts.
However, what is clear is that all three of the patterns we suggested earlier could be serving to maintain the strength of the link between Brexit preference and party support are largely doing so. In Table 3 we show separately for those who voted Conservative in 2019 and those who voted Labour the current Brexit preference of those who voted Remain and Leave in 2016. Among those who voted Conservative in 2019 and Remain in 2016, for every one person who would now vote to re-join the EU there is another who would now vote to stay out. Meanwhile, a little under half (46%) of those who voted Leave in 2016 and Labour in 2019 now say that they would vote to stay out of the EU, while just over one in three (35%) now state they would back re-joining the EU. In short, many a person who voted Conservative in 2019 after having voted Remain in 2016 is no longer a Remain supporter, while many of those who voted Labour in 2019 after having voted Leave in 2016 are no longer Brexiteers.
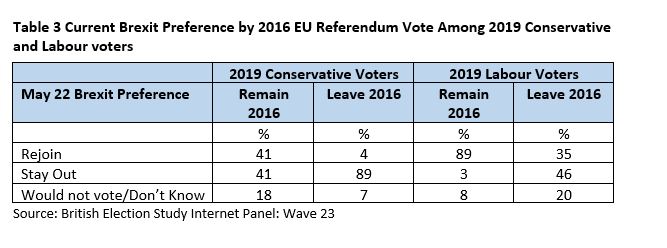
Meanwhile, there is also some evidence that those who have changed their minds about Brexit are also more likely to support a different party now from the one they backed in 2019. This is most apparent in the case of 2019 Conservative voters who have switched from having voted Leave in 2016 to backing re-joining by last May. Just 42% of this group say they would vote Conservative again, while as many as 31% would back Labour and 19% the Liberal Democrats. In contrast, 68% of 2019 Conservative voters who voted Leave in 2016 and still support being outside the EU would vote Conservative again (while 17% have switched to Labour and 11% to the Liberal Democrats). The equivalent analysis of 2019 Labour voters who have switched from voting Remain in 2016 to now supporting staying out shows that 74% of this group have remained loyal to Labour since 2019, a somewhat lower figure than the 81% among those who still support being part of the EU.
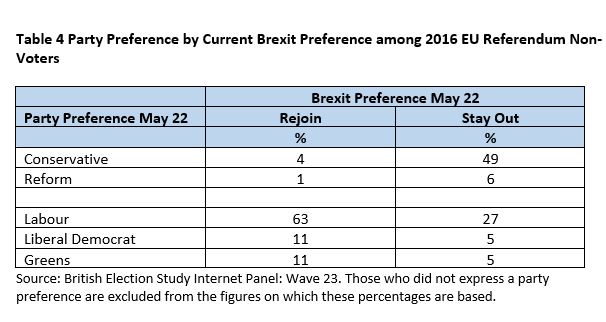
Finally, what of those who did not vote in the 2016 referendum? To what extent are the party preferences of those who now say they would vote Remain different from those who state they would back Leave? Table 4 reveals that those who would vote to re-join the EU are most likely to say they would vote Labour, while the Conservatives are most popular among those who would stay out. Indeed, note that among those who would re-join – and nearly half (46%) of all 2016 non-voters belong to this group – the 63% support registered for Labour is somewhat higher than it is among current Remain supporters who did vote in 2016 (57%). Thus, if anything, the party preferences of this group are serving to strengthen the link between Brexit preference and party support. The same, though, cannot be said of those who did not vote in 2016 but who now back Leave – at 49% the proportion who say they would vote Conservative is less than the equivalent figure of 65% among current Leave supporters who did vote in 2016. However, only one in six (17%) of those who did not vote in 2016 now say they would vote Leave, and thus their impact on the overall relationship is minimal.
Brexit has, then, far from disappeared from Britain’s electoral landscape – and its continued importance is clear once we look at the relationship between current Brexit preference and party choice rather than simply at how people voted in 2016. The Conservative party is still almost wholly reliant on the support of those in this group who want to be outside the EU. It is just that the party is not as dominant among this group as it once was. Although Labour have been advancing somewhat more strongly among Leave supporters than their Remain counterparts, the party remains heavily reliant on the support of those who would prefer to re-join the EU. To that extent, keeping quiet about Brexit appears to have brought the party limited reward. Meanwhile, as for the Liberal Democrats they appear to have lost ground among Remain supporters without reaping much of a harvest among those backing Leave. Crossing the Brexit divide successfully is still hard for parties to do.
By John Curtice
John Curtice is Senior Research Fellow at NatCen and at 'UK in a Changing Europe', Professor of Politics at Strathclyde University, and Chief Commentator on the What UK Thinks: EU website.
It is a curious fact that we persist in expressing the voting outcome of the 2016 BREXIT debate on the basis of those who actually voted – i.e. ~51.9% to 48.1%.
However, if we express it as a % of those eligible to vote then the figures become ~32.0% to 29.7% with ~23.8% non-voters with another ~14.8% eligible but un-registered.
Adding these two contributions of non-voters, we find that, at 38.3%, they are larger block than either the Leave or the Remain voters.
I may have missed it, but I have seen very little information or analysis about WHY these people didn’t vote (and whether they now regret their decision).
It would be deeply instructive if it could be arranged to elicit information from these people as to WHY they didn’t vote in 2016 and what they would now vote (or continue not to vote) if given the opportunity.
These people, being such a large block, are, actually, MORE important to understand than those who did actively vote one way or the other.
Did they literally not care one way or the other?
Were they so confused by the debate that they could come to no conclusion?
Were they so disgusted by the tone of the debate that they decided to refuse to engage?
Do they refuse to vote on any subject at all as a matter of principle?
Did they not even know that the issue was current at all?
etcetera?
*****************
Let us imagine that those who did not vote was an even larger portion of the total, say 70%.
Would we still have mechanically split the 30% who did vote into proportions of 51.9% and 48.1% and gone down the path of acting upon their marginal choice? I’m not sure.Report