Brexit may be done, but it continues to shape the pattern of voting behaviour in England. That was a clear message from the results of the double round of local and mayoral elections held on May 6.
It should not have come as a surprise. As we wrote before the elections, during the last twelve months the polls have consistently indicated that the Conservatives continue to be heavily reliant on the support of Leave voters, while Labour’s hopes of reconnecting with those who backed Brexit have so far come to nought. Because the seats up for grabs on May 6 were previously fought in May 2016 and May 2017, before much of the realignment of electoral support that occurred at the last two general elections had taken place, this meant that the Conservatives were set to advance most strongly in wards that voted heavily for Leave in 2016, while Labour would find it easier to make progress in areas that voted for Remain. Such a pattern would not necessarily indicate a further widening of the Brexit divide in voting behaviour, but rather might simply mean that the Brexit realignment of the last general election was now being replicated in the local contests.
However, this year two rounds of local elections were being held. One set was for positions last contested in 2016 while the other set were for an entirely different collection of councils that were last fought over in 2017. Those two previous rounds had produced very different results. In 2016 Labour were almost neck and neck with the Conservatives in the polls and this was reflected in the party’s local election performance. In 2017 Labour were almost twenty points behind, and while the outcome of the local elections were not as bad as that, the party still trailed the Conservatives by nine points or so.
The final GB-wide polls conducted prior to the May 6 elections put the Conservatives on average six points ahead of Labour, a slight narrowing as compared with the position a couple of weeks earlier. This implied that overall the Conservatives might make significant gains in those areas where the positions being contested were last fought over in 2016, but might fall back somewhat in places where the last election was in 2017. Indeed, this might even mean that there would be a swing from Conservative to Labour in places where the last election was in 2017 and which had voted Remain in 2016.
This is precisely what transpired. So far as the overall performances of the parties are concerned the BBC’s estimate of what the outcome of a GB-wide general election would be if the pattern of voting (in both sets of elections) replicated that found in the English local council ballot boxes, the Conservatives on 36% would be seven points ahead of Labour on 29%. True, at 17% the Liberal Democrats were well ahead of their current seven point standing in the polls, but the party always performs better in local government elections than parliamentary ones.
As a result, the Conservatives made net gains of 204 council seats in places where the last election was in 2016, while Labour suffered a net loss of 225 seats. In contrast, in those places where the previous contest was in 2017, the Conservatives emerged with no net gains or losses, while Labour lost a more modest 62 seats. That the Liberal Democrats’ performance was largely in line with that at other recent annual rounds of local elections is underlined by the fact that the party suffered just three net losses in seats where the previous election was in 2016, and only eleven net gains where it had been in 2017.
However, as the next two tables show, behind these overall figures were very different patterns in those wards that had voted most heavily for Leave in 2016 and those that had supported Remain in 2016.
First of all, in Table 1 we show for those places where the previous contest had been in 2016 how the level of support for the parties rose and fell broken down by the estimated outcome of the 2016 referendum locally.
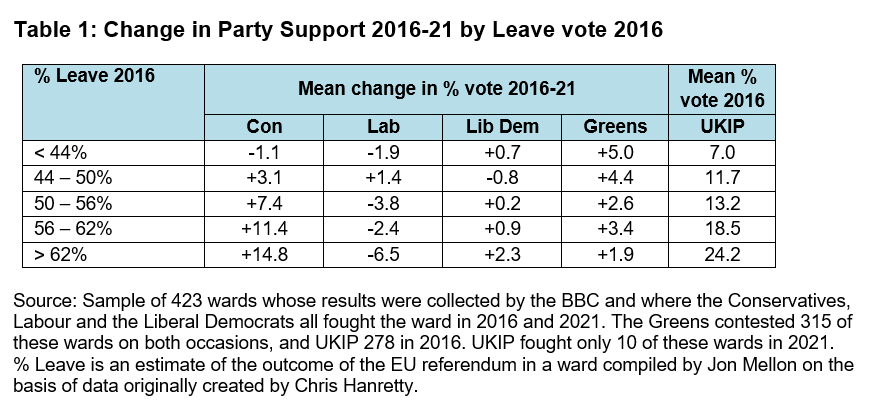
It is immediately apparent that the more heavily a ward voted Leave in 2016, the more strongly the Conservatives advanced between 2016 and 2021. In those wards where over 62% voted Leave in 2016 the Conservative share of the vote was on average as much as 15 points higher than it had been in 2016, whereas in wards where less than 44% had voted Leave there was actually a small drop in the Conservative tally of one percentage point. Not least of the reasons for this pattern is that the more pro-Brexit a ward had been in 2016 the more strongly UKIP had performed (where it stood) in that year’s local elections – thereby ensuring that these were places where the Conservatives were particularly likely to profit from their successful squeeze of the UKIP (and Brexit Party) vote at the 2017 and 2019 general elections. But even in the minority of wards that UKIP did not fight in either 2016 (or 2021), there was some tendency for the Conservatives to perform better in places that voted more heavily for Leave in 2016. In 30 such wards where more than 56% voted Leave the Conservative vote increased on average by 6.6 points while it fell by 2.7 points in 45 wards where less than 44% voted Leave.
Meanwhile, it is also apparent from the table that Labour performed rather less well in those places that voted most heavily for Leave than it did in those that backed Remain. The party’s vote fell on average by over six points where more than 62% backed Leave while it barely fell at all in wards where a majority voted Remain. Still, it is apparent that Labour’s performance varied in line with the strength of the Leave vote much less than did that of the Conservatives. This is not surprising; the realignment of party support occasioned by Brexit that took place between 2015 and 2019 had much more impact on who voted Conservative than it did on who voted Labour. However, the figures are a reminder that in the short-term at least, Labour’s principal difficulty in Leave-voting England has lain in the ability of the Conservatives to unite much of the Leave vote behind them, including not least those who had previously been expressing their Euroscepticism by backing UKIP (or more recently the Brexit Party), and that the impact on the character of the party’s own support has been more limited.
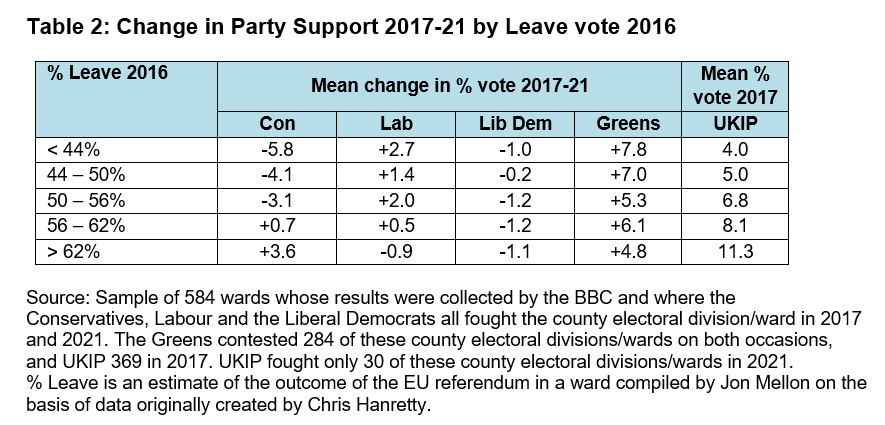
A similar picture is apparent in Table 2, which undertakes a similar analysis of the change in support between 2017 and 2021 in those wards where the seat being contested was last fought over in 2017. Here we can see that in those wards that voted most heavily for Leave the Conservative vote increased on average by four points, whereas it fell by six points in places that were keenest on remaining in the EU. In contrast, while Labour’s vote edged down a point in the most pro-Leave areas, it increased by up to three points in wards that had backed Remain.
However, there are then two further points to note. First, the difference in Table 2 between the Conservative performance in the most pro-Remain places and that in the most pro-Leave areas was, at nine points, notably less than the equivalent gap of 16 points in Table 1. By the time of the 2017 local elections the Brexit realignment in party support was already partially under way – support for UKIP was lower (see the far right hand side of Table 2), a trend from which the Conservatives profited – and therefore in those places where the previous election was in 2017 some of the impact of the realignment was already baked into the baseline results. Nevertheless, given the weaker Labour and stronger Conservative overall starting point in these wards, the pattern is still sufficient to result in a net swing from Conservative to Labour in those wards where Remain performed relatively well. But rather than providing evidence of rare green shoots for Labour, the party’s relative success in some places where the last election had been held in 2017 primarily reflected the party’s weaker overall performance four years ago. In particular, this pattern helps explain why Labour made a few notable gains in the South of England, where many more of the seats being contested were last fought over in 2017 rather than in 2016.
The outcome of the mayoral and assembly elections in Remain-voting London was largely in line with the pattern outside the capital. Despite the last contest having taken place in 2016, there was only a modest net swing of two points from Labour to Conservative in both the mayoral contest and the London-wide list vote. In Wales, however, where UKIP won 13% of the list vote in the Assembly election in 2016 and where subsequently 53% voted Leave, the picture was less consistent with that in the English local elections. Although the four-five point increase in the Conservatives’ share of the vote was enough the give the party its highest ever share of the vote in a devolved election and the increase was even higher in the most pro-Leave constituencies in Wales, it was rather less than might have been expected, given the pattern in England. Meanwhile, the Conservatives’ performance was matched by a five-point increase in Labour’s share of the vote, well above what Labour was achieving in similar circumstances in England.
Our two tables also provide information on the pattern of Liberal Democrat and Green performance. The Liberal Democrats’ performance was a little weaker than in 2017, but a little stronger than in 2016. However, apart from advancing a little more strongly in the most pro-Leave wards where the last election was in 2016, there is little sign of the rise and fall in party support reflecting how an area voted in the EU referendum. That said, the party’s share of the vote was on average still twice as high in wards where less than 44% voted Remain (24.6%) than it was in those where more than 62% did so (12.3%).
The Greens, in contrast, performed more strongly than they did in both 2016 and 2017 (though somewhat less well than in 2019). This perhaps was to be expected given that the party has been running at 5% in the polls, up on both the 3% rating the party had in May 2016 and the 4% one twelve months later. Strikingly, however, (and again in contrast to the Liberal Democrats), the increase in support for the party was rather stronger in areas that voted to Remain in the EU. This helped ensure that the party’s average share of the vote in wards that voted most heavily for Remain (17.5%) was more than twice as high than it was in those wards that produced the strongest support for Leave (8.4%).
So, the realignment in party support occasioned by Brexit is still with us. It had a significant impact on where the parties did relatively well and where they performed badly on May 6, as the pattern of voting in the English local elections came to reflect that unveiled in the 2019 general election. In combination with its overall low level of popularity, the particular difficulty facing Labour in more Leave-inclined parts of the country was underlined. However, that does not mean that Brexit has made it impossible for Labour to win elections. The party’s relative success in Wales, where it may have profited from approval of the roll out of the COVID-19 vaccine in much the same way as it seems to have helped the Conservatives in England, is testament to that. What remains to be seen is whether across the UK as a whole the party can find a more effective way of winning over both Remain and Leave voters than it seems to have found so far.
Acknowledgement
Much of the analysis reported here was undertaken with the help of Patrick English, Rob Ford, Eilidh Macfarlane, Jon Mellon, and Stephen Fisher. Responsibility for the views expressed lies with the author.
By John Curtice
John Curtice is Senior Research Fellow at NatCen and at 'UK in a Changing Europe', Professor of Politics at Strathclyde University, and Chief Commentator on the What UK Thinks: EU website.
Is it correct to assume that COVID – 19 has had absolutely no effect on the standing of any of the parties?Report