One of the key points of speculation during the EU referendum campaign was what impact voter turnout might have on the outcome. Support for Remain was known to be higher amongst younger people, who generally tend to be less likely to vote, but also higher amongst graduates, who tend to be more likely to do so. Thus, so far as traditional demographic patterns were concerned, it was far from clear which side had the more reason to worry about whether its supporters would make it to the polls or not.
But there was, of course, no guarantee that the traditional patterns of turnout would pertain in the referendum. After all, Nigel Farage in particular has often claimed that UKIP, a party defined by its Euroscepticism, has been successful in winning the support of those who are not regular visitors to their local polling station. If so, then perhaps Leave would be similarly successful in mobilising this group in the referendum, and thereby ensure that past experience would prove to be an unreliable guide to who would vote on June 23?
To date, reliable evidence on the pattern of turnout in the referendum has been limited. This is because most previous polling of the referendum has struggled to identify those who did not participate in the referendum. For example, at 6%, the proportion of non-voters in the on the day poll conducted by YouGov was well down on the official abstention rate of 29%, and is so low that it is arithmetically impossible to discern much in the way of variation between different groups. With a 7% abstention rate the same is true of the otherwise admirable large scale British Election Study internet panel. Meanwhile, Lord Ashcroft’s on the day poll did not attempt to estimate turnout at all.
However, some light has now been cast on the issue by the publication of the results of the post-referendum wave of NatCen’s mixed mode panel. Regular readers will be aware that this comprises people who were first interviewed for the 2015 British Social Attitudes (BSA) survey and who have agreed to respond to short follow-up surveys either via the internet or by phone. What sets this panel apart from regular internet polls is that the panel members were originally selected for interview at random rather than having ‘volunteered’ to join the panel, while the fieldwork for each wave takes place over a month rather than a few days.
These features make it more likely that the panel will make contact with those with little or no interest in politics, and who thus, perhaps, did not vote in the referendum. That said, we should remember that those who are willing to answer a short survey on a regular basis may not be typical of their fellow citizens, including not least in their willingness to participate in a referendum, and thus even this exercise might well still underestimate the overall level of abstention. (Further evidence on the pattern of turnout will come from the 2016 British Social Attitudes survey which has asked a fresh cross-section of voters whether and how they voted.)
Indeed, at 18% the reported level of abstention in NatCen’s panel is still well below the official turnout rate when its members were asked between mid-September and mid-October whether and how they had voted. But at least the level is high enough for it to be possible arithmetically for the turnout to vary noticeably between one group of voters and another. Moreover, we also have information (from their first BSA interview conducted last year), on whether panel members voted in the 2015 general election, thereby making it possible to compare the turnout in the two ballots directly. And, at eight points, the difference between the level of turnout amongst the panellists in the referendum in 2016 and that in the UK general election in 2015 is only slightly above the six point increase registered in the official tally. So there is good reason to believe that the panel might prove to be a reliable guide to whether the pattern of turnout in the referendum was different from what is often observed in a general election – and it is that question which is addressed here.
Demographic Differences
Let us look, first of all, at the demographics of turnout, with which we began this blog. In Table 1 we show how the reported level of turnout amongst NatCen panellists varied by age both in 2015 and in 2016. It reveals that turnout increased amongst all age groups. However, at six points, the increase amongst those aged 55 and over was no more than half that found amongst younger voters. That, in truth, is not entirely surprising. For given that the reported level of turnout was already as high as 84% in 2015, there was an arithmetical limit on how much higher it might go amongst older voters.
Table 1 Voter turnout by age group
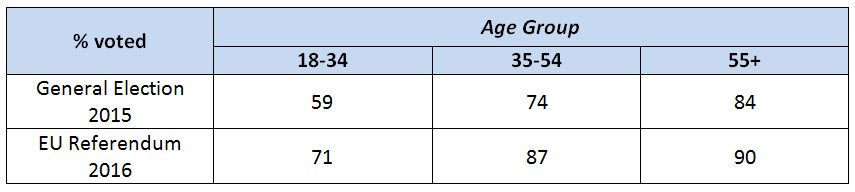
Source: NatCen mixed mode panel. All figures based on those participating in the Sept/Oct 2016 wave, and after the data have been weighted to reflect known patterns of non-response. Total sample size = 1391
But if the higher overall level of turnout brought with it some narrowing of the age gap in turnout, we should also note that turnout did not increase especially sharply amongst the youngest age group. Participation amongst the under 35s increased by 12 points, no more than it did amongst those aged between 35 and 54. So it appears that the Remain camp were not particularly successful at increasing participation amongst what for them was a crucial demographic group.
Much the same picture is painted if, as in Table 2, we look at how turnout varied according to someone’s educational background. Turnout rose rather less amongst university graduates, amongst whom it was already relatively high, but otherwise appears to have increased by the same amount irrespective of someone’s educational background. The result was an education gap that was already less sharp than the age gap also narrowed somewhat. That, of course, was not especially helpful to the Remain side.
Table 2 Voter turnout by education
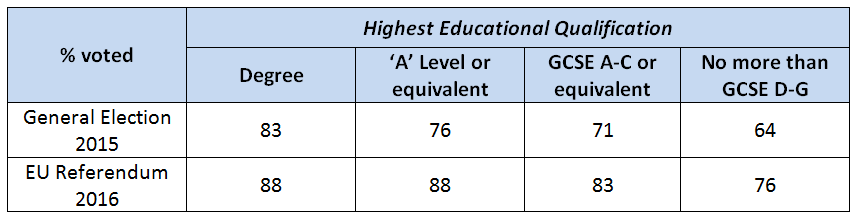
Source: See Table 1
Mobilising the Politically Disengaged
What then both tables have in common is a hint – though no more than that – that turnout increased most amongst those groups where it was relatively low in 2015. However, if we look not at demographic differences in turnout but at how far turnout increased amongst those with little cognitive or emotional investment in the political process, we obtain a much sharper picture. In Table 3 we show how turnout varied in the 2015 election and 2016 referendum between those with more and less interest in politics and between those who identify strongly with a particular political party and those who do not. The table shows that amongst those who have a strong interest in politics and those who identify strongly with a political party, turnout barely increased at all – primarily because almost everyone in these groups turned out in 2015. Much of the increase in turnout in 2016 occurred amongst those with little interest in politics and, above all, those who do not regard themselves as a supporter of any party, a group that nowadays comprises some one in five of all voters.
Table 3 Voter turnout by interest in politics and strength of party identification
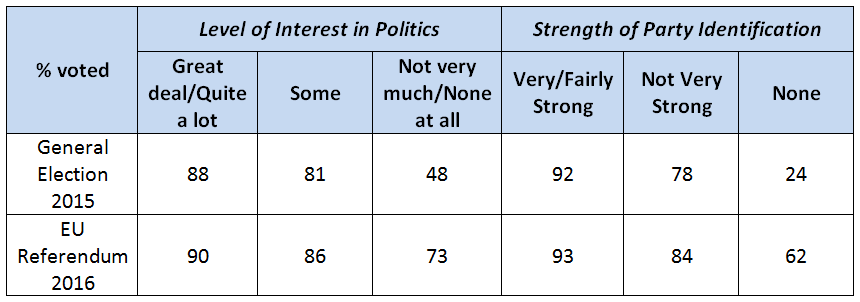
Source: As Table 1
This pattern mattered. Those without much interest in politics and those who do not identify with a party were much more likely to have voted for Leave than those with an interest in politics and those with a strong party identity. No less than 64% of NatCen’s panellists with little or no interest in politics who voted in the referendum backed Leave, whereas amongst the remainder there was a small majority (53%) in favour of Remain. Similarly, as many as 72% of those who do not identify with a political party voted for Leave, whereas again, amongst the remainder of the sample Remain (52%) was slightly ahead.
It appears then that one of the vital ingredients in the Leave campaign’s success in the referendum was an especially marked increase in the participation rate of those who are usually relatively disengaged from the political process, many of whom proved to be Leave supporters. It is this development that lies behind the finding that Kirby Swales reported in his analysis paper earlier this month that amongst those who voted in the referendum but did not vote in the general election, no less than 60% voted for Leave, whereas amongst those who had voted the previous year only 49% did so.
Of course, this raises the important question as to what motivated these less politically engaged voters first of all to vote and then in so doing to back Leave. Interestingly, further analysis suggests that when it came to the implications of leaving the EU for immigration, the views of less engaged voters who voted in the referendum were much the same as those of the more engaged. They were just like everyone else in the extent to which they expected that immigration would fall. Where they do stand out is in their views of the economic consequences of leaving the EU. Around 40% of the less engaged thought (when interviewed shortly before the referendum) that Britain’s economy would be better off if we left, whereas amongst the remainder of the electorate only one in four took that view. Perhaps for many a politically disengaged voter, the EU referendum came to be seen as a more effective opportunity to signal that they really did feel economically ‘left behind’ than voting Conservative or Labour had ever appeared to be?
By John Curtice
John Curtice is Senior Research Fellow at NatCen and at 'UK in a Changing Europe', Professor of Politics at Strathclyde University, and Chief Commentator on the What UK Thinks: EU website.
I personally canvassed more than 5,000 people and had longer conversations with about 800 of them during the Referendum campaign and what was apparent to me from quite early on was that the campaign was engaging people not normally engaged by politics.This seemed to be the result of two factors. Firstly, people recognised how serious the issue was and that they were deciding the future direction of the country. Most people thought casting their vote was a big responsibility and took it very seriously. Secondly, people recognised that their vote would count (incidentally I didn’t speak to a single person who said they thought the vote was advisory). This surprised me. People I wouldn’t have thought were particularly politically aware said things like ‘This isn’t like a General Election. Its yes or no. My vote counts’. One thing I am certain of is that if that vote is disregarded and we do not leave the EU as people expect, there will be a significant number of people who will never vote again. They will say we are ignored anyway, what’s the pointReport