What UK Thinks: EU exists to allow academics, journalists, campaigners and members of the public to access and analyse all of the key poll and survey data available on what the UK public thinks about the future of Europe and Britain’s membership of the EU. In order to enhance users’ ability to analyse the data that we display, we recently introduced three new functions to the Opinion Polls section of the site: the options to filter by pollster and mode, and a ‘Combine responses’ function.
Filter by pollster/mode
The new filters are easy to use and allow you to view polls conducted by selected polling companies and/or using a particular mode (i.e. telephone, online or face-to-face).
This allows you to explore whether differences between polling results could be based on how they are conducted and which company they are conducted by.
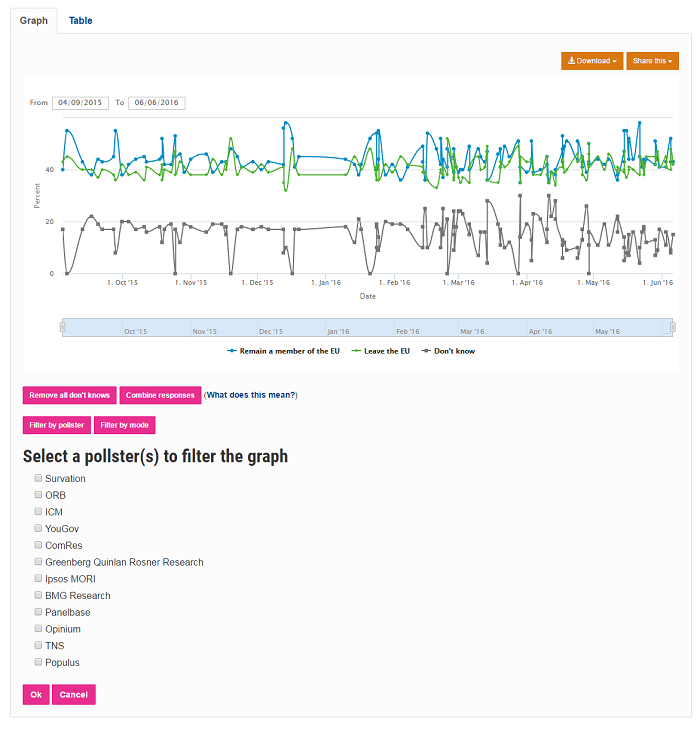
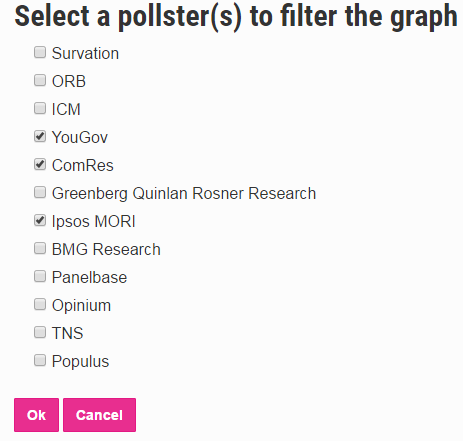
Clicking on the ‘Filter by pollster’ or ‘Filter by mode’ buttons under the graph will show you the pollsters and modes that you can choose from:
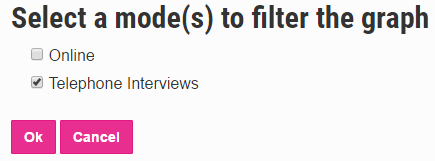
You can filter by pollster, by mode, or combine the two:
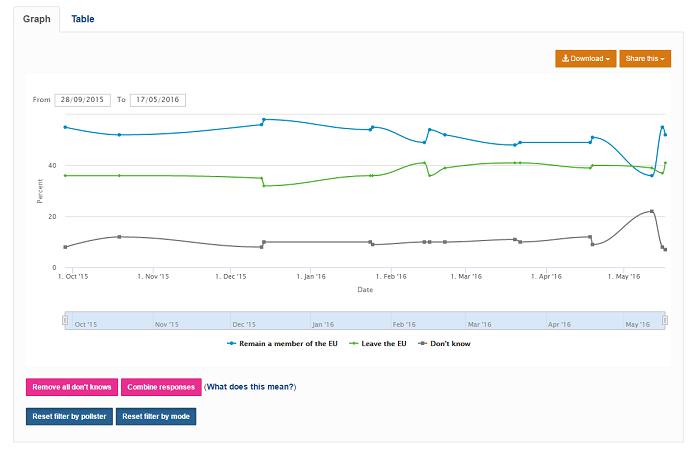
To go back to the original view, click ‘Reset filter by pollster’ and/or ‘Reset filter by mode’:
Combine responses
The ‘Combine responses’ function allows you to combine two or more response options to an individual question into a new category. Doing this can help create a broad overview of what the results are telling us.
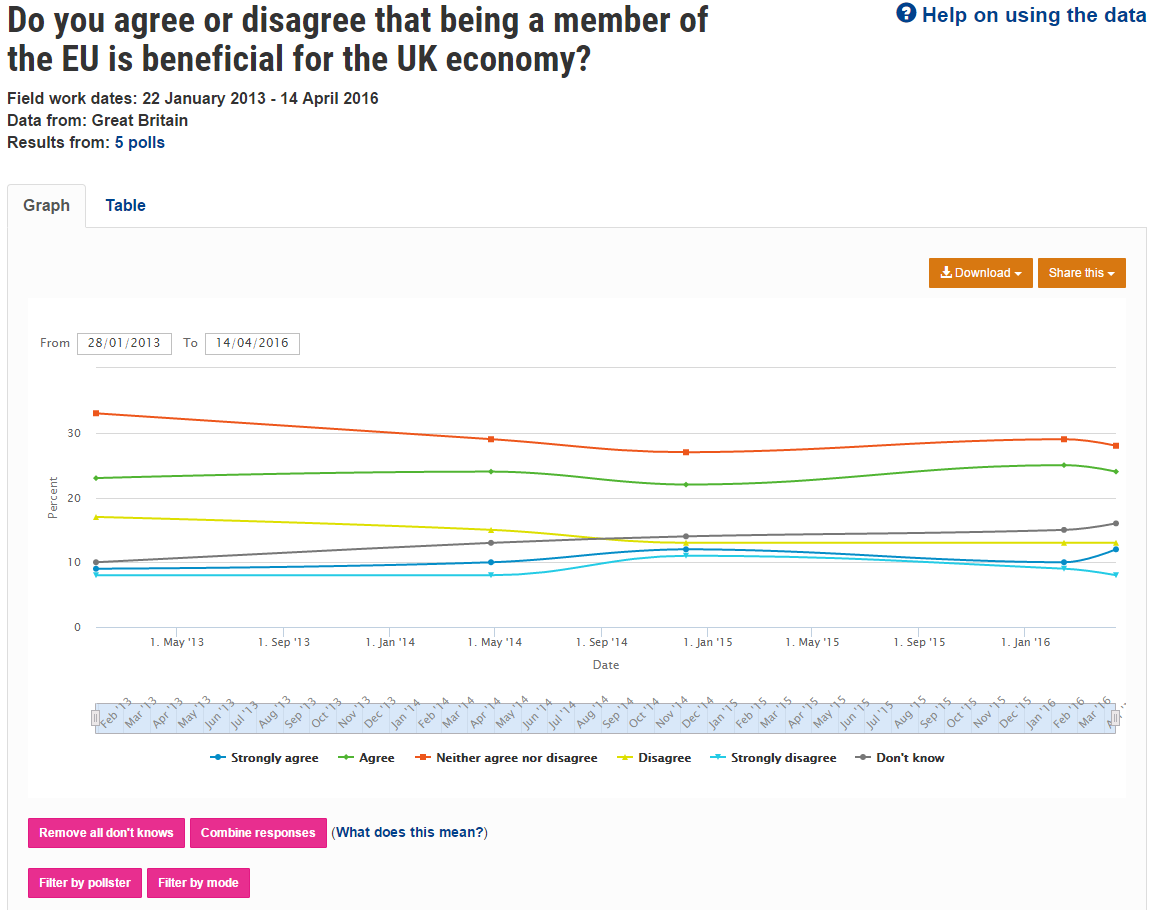
A common example of where this might be useful is where a numeric scale is used to assess respondents’ feelings towards a particular issue (e.g. ‘Do you agree or disagree that Brexit will cause an economic recession?‘). This question asks respondents to express how much they agree or disagree with a statement by placing themselves on a 0-10 scale, where 0 = ‘Completely disagree’ and 10 = ‘Completely agree’. Here, you may wish to combine answer options 0-4 and 6-10 in order to produce a net agree/disagree figure. Similarly, you may wish to combine responses where a scale is used to assess the extent to which respondents agree or disagree with a given statement (e.g. ‘Do you agree or disagree that being a member of the EU is beneficial for the UK economy?’) in order to examine the number of people who broadly agree or disagree with that statement.
How to use the ‘Combine responses’ function:
1. Click the ‘Combine responses’ button below the table/graph relating to the question you want to analyse.
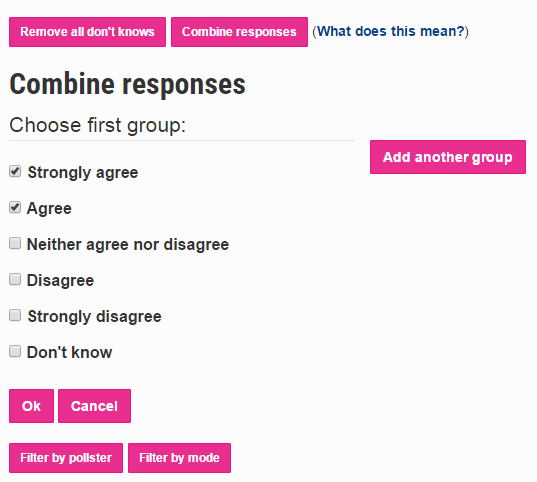
2. Select the options you wish to combine by clicking the tick-box next to your chosen options.
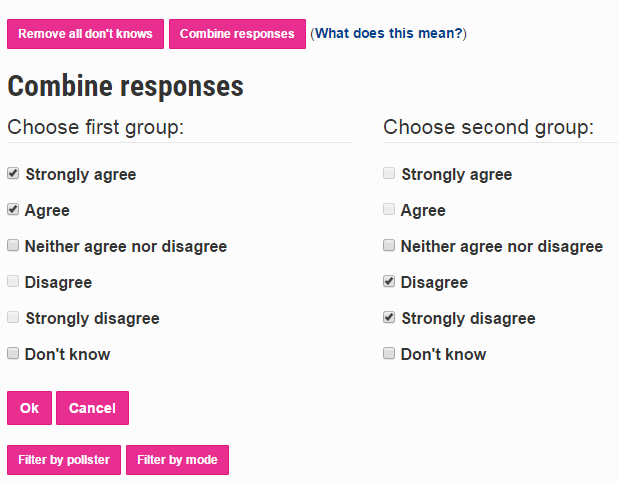
3. To select a second group, click the ‘Add another group’ button. Select the second group of options you wish to combine by clicking the tick-box next to your chosen options.
4. Click the ‘Ok’ button. The table/graph will now display your combined responses as one group.
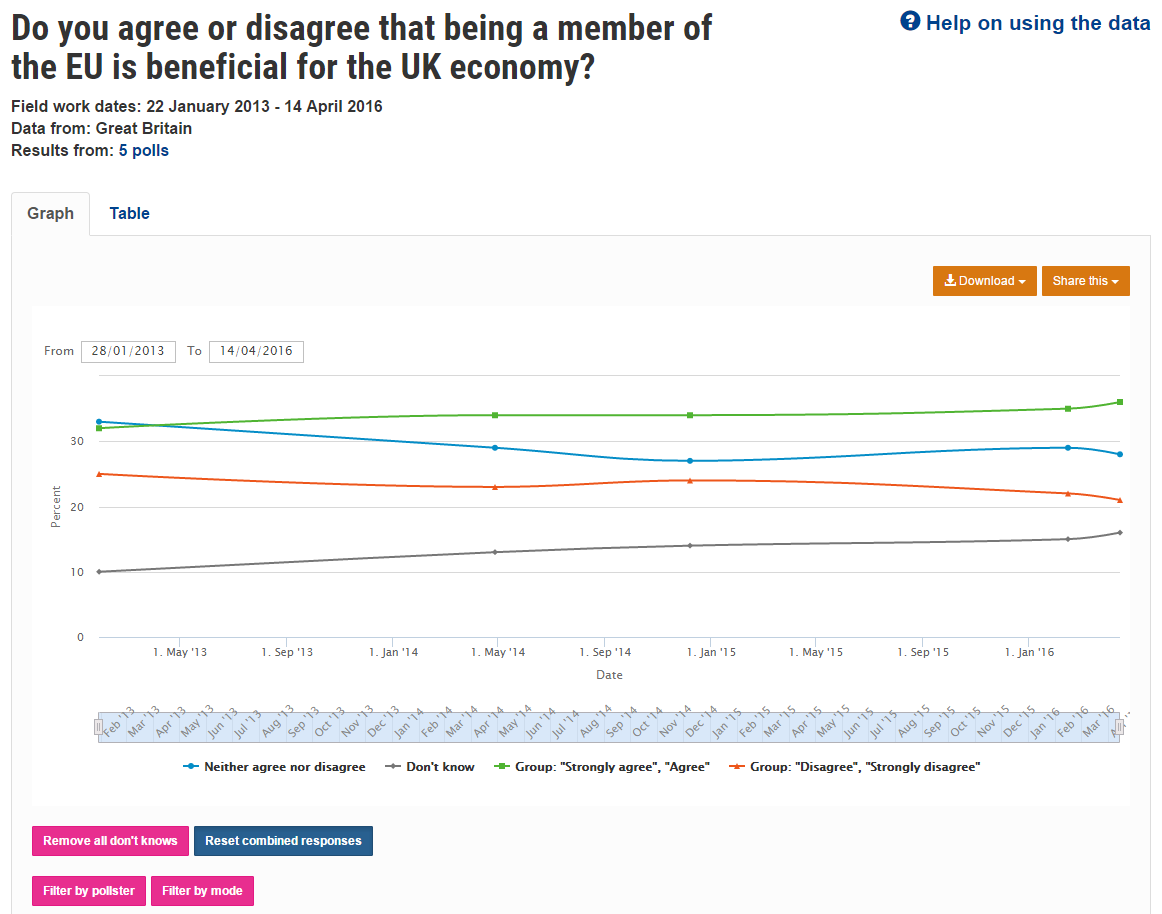
5. To return the answer options to their original format, click the ‘Reset combined responses’ button.
By Ian Montagu
Ian Montagu is a doctoral student at the University of Strathclyde and was previously a Senior Researcher at ScotCen Social Research. Ian has a particular interest in political attitudes and social equality, and is currently researching associations between attitudes towards the European Union and other areas of public policy.
In fact just checking a few more pollsters websites, you have also made an error, (yet again to the detriment of the leave camp), with regards to the ORB poll on the 29th May, you have Remain at 51%, Leave 42% and Don’t knows at 7%, yet the ORB website has the following poll figures. Remain 51%, Leave 46% and Don’t Knows at 3%..
Are these genuine errors? Is it that hard to check the information before including them on your website.Report
Hi Shaun. Please note the following paragraph from Prof. Curtice’s previous blog, which we hope addresses your query:
‘…there is some confusion about what ORB’s vote intention figures are. In its reporting of the company’s polls the Daily Telegraph focuses on the share of the vote for the two sides amongst the sub-sample of ORB’s respondents who say they are certain to vote. However, the practice that we follow on this site is to focus on the figures the polling company in question regards as its headline numbers, and ORB have advised that they prefer to focus on the vote intentions for all respondents to their polls. Thus the numbers quoted above, and those reported elsewhere on this site, are for all respondents in ORB’s polls, numbers which tend to be more favourable to Remain than those on which the Telegraph focuses’
Best wishes,
The http://www.whatukthinks.org/eu team Report
Great added functionality, but it would help if the basic information was correct in the first place.
You currently have the 5th June ORB poll, at 52% remain and 40% Leave and 7% Don’t Know. However the actual result from that poll as noted on the ORB website, was 48% remain, 47% leave and 5% Don’t Know. This is not the first time erroneous and incorrect figures have been listed.
If you are trying to give the impression of impartiality, then I’m afraid currently unless you sort out these basic errors, then you are sadly failing
Report